Categories
Posts in this category
- Current State of Exceptions in Rakudo and Perl 6
- Meet DBIish, a Perl 6 Database Interface
- doc.perl6.org and p6doc
- Exceptions Grant Report for May 2012
- Exceptions Grant Report -- Final update
- Perl 6 Hackathon in Oslo: Be Prepared!
- Localization for Exception Messages
- News in the Rakudo 2012.05 release
- News in the Rakudo 2012.06 release
- Perl 6 Hackathon in Oslo: Report From The First Day
- Perl 6 Hackathon in Oslo: Report From The Second Day
- Quo Vadis Perl?
- Rakudo Hack: Dynamic Export Lists
- SQLite support for DBIish
- Stop The Rewrites!
- Upcoming Perl 6 Hackathon in Oslo, Norway
- A small regex optimization for NQP and Rakudo
- Pattern Matching and Unpacking
- Rakudo's Abstract Syntax Tree
- The REPL trick
- First day at YAPC::Europe 2013 in Kiev
- YAPC Europe 2013 Day 2
- YAPC Europe 2013 Day 3
- A new Perl 6 community server - call for funding
- New Perl 6 community server now live, accepting signups
- A new Perl 6 community server - update
- All Perl 6 modules in a box
- doc.perl6.org: some stats, future directions
- Profiling Perl 6 code on IRC
- Why is it hard to write a compiler for Perl 6?
- Writing docs helps you take the user's perspective
- Perl 6 Advent Calendar 2016 -- Call for Authors
- Perl 6 By Example: Running Rakudo
- Perl 6 By Example: Formatting a Sudoku Puzzle
- Perl 6 By Example: Testing the Say Function
- Perl 6 By Example: Testing the Timestamp Converter
- Perl 6 By Example: Datetime Conversion for the Command Line
- What is Perl 6?
- Perl 6 By Example, Another Perl 6 Book
- Perl 6 By Example: Silent Cron, a Cron Wrapper
- Perl 6 By Example: Testing Silent Cron
- Perl 6 By Example: Stateful Silent Cron
- Perl 6 By Example: Perl 6 Review
- Perl 6 By Example: Parsing INI files
- Perl 6 By Example: Improved INI Parsing with Grammars
- Perl 6 By Example: Generating Good Parse Errors from a Parser
- Perl 6 By Example: A File and Directory Usage Graph
- Perl 6 By Example: Functional Refactorings for Directory Visualization Code
- Perl 6 By Example: A Unicode Search Tool
- What's a Variable, Exactly?
- Perl 6 By Example: Plotting using Matplotlib and Inline::Python
- Perl 6 By Example: Stacked Plots with Matplotlib
- Perl 6 By Example: Idiomatic Use of Inline::Python
- Perl 6 By Example: Now "Perl 6 Fundamentals"
- Perl 6 Books Landscape in June 2017
- Living on the (b)leading edge
- The Loss of Name and Orientation
- Perl 6 Fundamentals Now Available for Purchase
- My Ten Years of Perl 6
- Perl 6 Coding Contest 2019: Seeking Task Makers
- A shiny perl6.org site
- Creating an entry point for newcomers
- An offer for software developers: free IRC logging
- Sprixel, a 6 compiler powered by JavaScript
- Announcing try.rakudo.org, an interactive Perl 6 shell in your browser
- Another perl6.org iteration
- Blackjack and Perl 6
- Why I commit Crud to the Perl 6 Test Suite
- This Week's Contribution to Perl 6 Week 5: Implement Str.trans
- This Week's Contribution to Perl 6
- This Week's Contribution to Perl 6 Week 8: Implement $*ARGFILES for Rakudo
- This Week's Contribution to Perl 6 Week 6: Improve Book markup
- This Week's Contribution to Perl 6 Week 2: Fix up a test
- This Week's Contribution to Perl 6 Week 9: Implement Hash.pick for Rakudo
- This Week's Contribution to Perl 6 Week 11: Improve an error message for Hyper Operators
- This Week's Contribution to Perl 6 - Lottery Intermission
- This Week's Contribution to Perl 6 Week 3: Write supporting code for the MAIN sub
- This Week's Contribution to Perl 6 Week 1: A website for proto
- This Week's Contribution to Perl 6 Week 4: Implement :samecase for .subst
- This Week's Contribution to Perl 6 Week 10: Implement samespace for Rakudo
- This Week's Contribution to Perl 6 Week 7: Implement try.rakudo.org
- What is the "Cool" class in Perl 6?
- Report from the Perl 6 Hackathon in Copenhagen
- Custom operators in Rakudo
- A Perl 6 Date Module
- Defined Behaviour with Undefined Values
- Dissecting the "Starry obfu"
- The case for distributed version control systems
- Perl 6: Failing Softly with Unthrown Exceptions
- Perl 6 Compiler Feature Matrix
- The first Perl 6 module on CPAN
- A Foray into Perl 5 land
- Gabor: Keep going
- First Grant Report: Structured Error Messages
- Second Grant Report: Structured Error Messages
- Third Grant Report: Structured Error Messages
- Fourth Grant Report: Structured Error Messages
- Google Summer of Code Mentor Recap
- How core is core?
- How fast is Rakudo's "nom" branch?
- Building a Huffman Tree With Rakudo
- Immutable Sigils and Context
- Is Perl 6 really Perl?
- Mini-Challenge: Write Your Prisoner's Dilemma Strategy
- List.classify
- Longest Palindrome by Regex
- Perl 6: Lost in Wonderland
- Lots of momentum in the Perl 6 community
- Monetize Perl 6?
- Musings on Rakudo's spectest chart
- My first executable from Perl 6
- My first YAPC - YAPC::EU 2010 in Pisa
- Trying to implement new operators - failed
- Programming Languages Are Not Zero Sum
- Perl 6 notes from February 2011
- Notes from the YAPC::EU 2010 Rakudo hackathon
- Let's build an object
- Perl 6 is optimized for fun
- How to get a parse tree for a Perl 6 Program
- Pascal's Triangle in Perl 6
- Perl 6 in 2009
- Perl 6 in 2010
- Perl 6 in 2011 - A Retrospection
- Perl 6 ticket life cycle
- The Perl Survey and Perl 6
- The Perl 6 Advent Calendar
- Perl 6 Questions on Perlmonks
- Physical modeling with Math::Model and Perl 6
- How to Plot a Segment of a Circle with SVG
- Results from the Prisoner's Dilemma Challenge
- Protected Attributes Make No Sense
- Publicity for Perl 6
- PVC - Perl 6 Vocabulary Coach
- Fixing Rakudo Memory Leaks
- Rakudo architectural overview
- Rakudo Rocks
- Rakudo "star" announced
- My personal "I want a PONIE" wish list for Rakudo Star
- Rakudo's rough edges
- Rats and other pets
- The Real World Strikes Back - or why you shouldn't forbid stuff just because you think it's wrong
- Releasing Rakudo made easy
- Set Phasers to Stun!
- Starry Perl 6 obfu
- Recent Perl 6 Developments August 2008
- The State of Regex Modifiers in Rakudo
- Strings and Buffers
- Subroutines vs. Methods - Differences and Commonalities
- A SVG plotting adventure
- A Syntax Highlighter for Perl 6
- Test Suite Reorganization: How to move tests
- The Happiness of Design Convergence
- Thoughts on masak's Perl 6 Coding Contest
- The Three-Fold Function of the Smart Match Operator
- Perl 6 Tidings from September and October 2008
- Perl 6 Tidings for November 2008
- Perl 6 Tidings from December 2008
- Perl 6 Tidings from January 2009
- Perl 6 Tidings from February 2009
- Perl 6 Tidings from March 2009
- Perl 6 Tidings from April 2009
- Perl 6 Tidings from May 2009
- Perl 6 Tidings from May 2009 (second iteration)
- Perl 6 Tidings from June 2009
- Perl 6 Tidings from August 2009
- Perl 6 Tidings from October 2009
- Timeline for a syntax change in Perl 6
- Visualizing match trees
- Want to write shiny SVG graphics with Perl 6? Port Scruffy!
- We write a Perl 6 book for you
- When we reach 100% we did something wrong
- Where Rakudo Lives Now
- Why Rakudo needs NQP
- Why was the Perl 6 Advent Calendar such a Success?
- What you can write in Perl 6 today
- Why you don't need the Y combinator in Perl 6
- You are good enough!
Sun, 16 Aug 2009
A SVG plotting adventure
Permanent link
The Quest
It usually begins with Carl Mäsak - this time was no exception.
First he sent us on big adventure, and then me on a particular quest by asking innocently if there were any vistor statics for the site http://perl6-projects.org. Being curious myself I copied the access.log, started a log analyzer and voilá, we had a HTML page with some statistics.
But a tiny nagging voice in my head asked Can't you do that with Perl 6?. Well, sure I can, with a bit of effort.
So I decided to spend some time of my weekend (namely a travel by train and the time when my girlfriend took a nap) on this, and wrote a web log analyzer that produced a bar chart of the daily number of visitors. Here it goes:
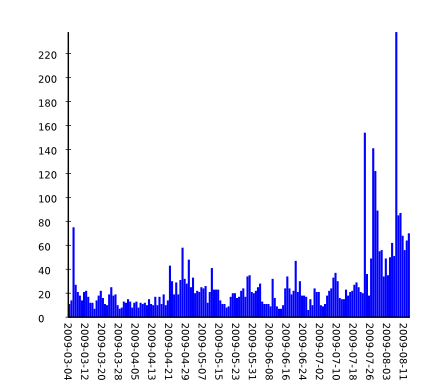
If you use a browser that supports SVG, you can view the svg version directly..
That was the short story. If you are more of a geek, you might be more interested in some of technical details.
The Gory Details - SVG
The choice of SVG as output format was pretty obvious: It's text based, a vector format, and masak had already written a SVG module for Perl 6. Despite its name, it's actually a module that generally transforms data structures of a particular form to XML - the only things specific to SVG in there are the name and the documentation.
Since it doesn't know about SVG, I as the programmer had to learn some SVG. So I downloaded the specs, and went offline.
Coordinate transformations
Skimming through the specs revealed something interesting: you can apply coordinate transformations to SVG primitives or groups. Also the drawing area stretches from negative to positive infinity in both x and y direction. In combination that means that the plotting module can start drawing without looking at the whole input data. It just has to keep track of how much space it has written to, and then in the end it can apply a scaling to fit the canvas (ie the visible drawing area).
There's just one problem with this approach:
The text is scaled with the same aspect ratio as the chart, leading to distorted text. Of course one could apply the reverse transformation to the text, but to avoid overlapping label text one has to know the size of the text anyway, so there's nothing gained by letting the SVG renderer do coordinate transformation.
So I ended up doing the scaling in my program code after all.
Text in SVG
There's one open problem so far: since the plotting program just emits SVG (or more accurately, a data structure which SVG.pm turns into SVG) and doesn't know about its rendering, it can't know how much space the text will take up, making it impossible to calculate the spaces appropriately. Inkscape and gqview render the text quite differently, I'm sure other user agents will have their own interpretation of text sizes and scaling.
The specs talks about precomputed text width according to which text might be scaled; I'll have to see if I can make use of that feature to solve this problem.
SVG != SVG
Speaking of different user agents: Firefox and gqview only show drawing on the canvas, silently (as per SVG spec) dropping elements outside the canvas. It was incredible helpful to have inkscape, which shows the border of the canvas, but also objects outside of it. When I got a coordinate transform wrong, that was a good way to debug it.
Mandatory Options
I made one observation not tied to SVG, but to plotting in general: without having planned for it, I ended up with having about ten configuration variables/attributes, more to come when I include captions, axis labels and so on. It just falls naturally out of process of writing the code, and thinking twice each time I used a numeric constant in code.
Perl 6 makes them very nice, the begin of the code looks like this:
class SVG::Plot {
    has $.height            = 200;
    has $.width             = 300;
    has $.fill-width        = 0.80;
    has $.label-font-size   = 14;
    has $.plot-width        = $.width  * 0.80;
    has $.plot-height       = $.height * 0.65;

    has &.y-tick-step       = -> $max_y {
        10 ** floor(log10($max_y)) / 5
    }

    has $.max-x-labels      = $.plot-width / (1.5 * $.label-font-size);

    has $.label-spacing     = ($.height - $.plot-height) / 20;
    ...
}
Basically I declare attributes with default values, which can be overridden
by passing a named argument to the new constructor - and the
subsequent declarations which depend on them simply pick up the user supplied
value if present, or the default otherwise.
It seems easier to come up with a myriad of configuration options than choosing sane defaults.
The Result
... can be found on http://github.com/moritz/svg-plot/.
The log parser is included in the examples/ directory.
It is far from complete, the interface is not yet stable etc, but it's still a nice piece of software, IMHO.
The Future
I want to pursue development in a few directions: more meta data (axis labels, captions, annotations, maybe clickable data points), other chart types (lines and points), documentation, and maybe more styling options.
I don't know yet how to write unit tests for it, and test driven development only works if you know in advance what to expect.
I don't know if I'll find the time to turn this into a full-blown charting module, but so far the work on it has been very rewarding, and I liked it.